Global Grants & Fiscal Sponsorships Overview
Here's a look at our Global Grants program thanks to our exceptionally generous donors.
In 2023... we distributed $1.6+ million through 260 grants to 163 grantees.
Since 2009... we have distributed 3,000+ grants totalling $15+ million in 95 countries!
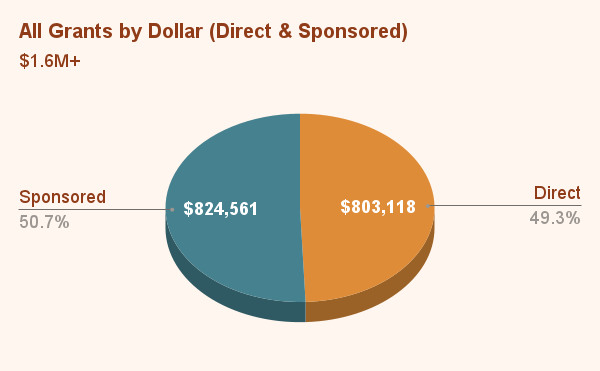
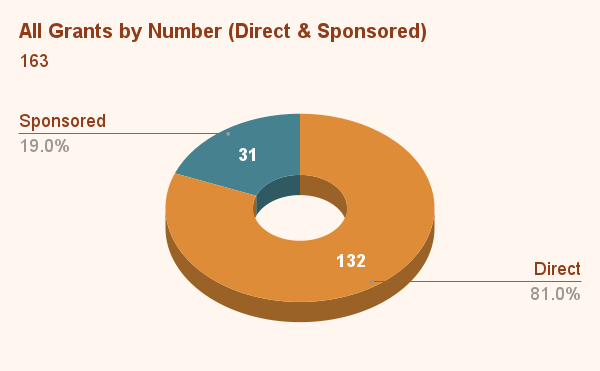
ORANGE/TEAL DARK: Direct vs Sponsored
The first pie chart below illustrates the $1.6+ million breakdown by dollar, nearly evenly split with dark orange representing $803.118 in direct grant funding (including our Plants-4-Hunger program) and the dark teal representing the $824,561 in facilitated grants through our FREE fiscal sponsorship program. (Distributions vary depending on the amount of donations received -- it's a coincidence that their amounts are so close.)
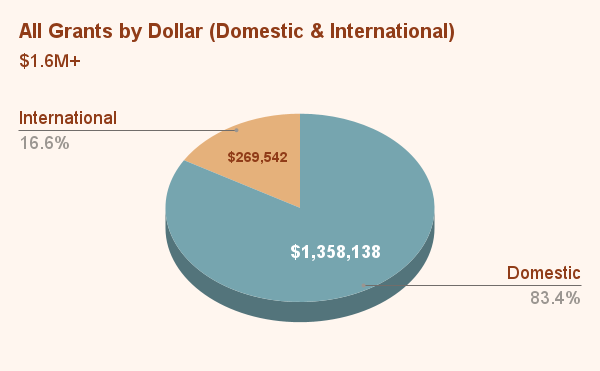
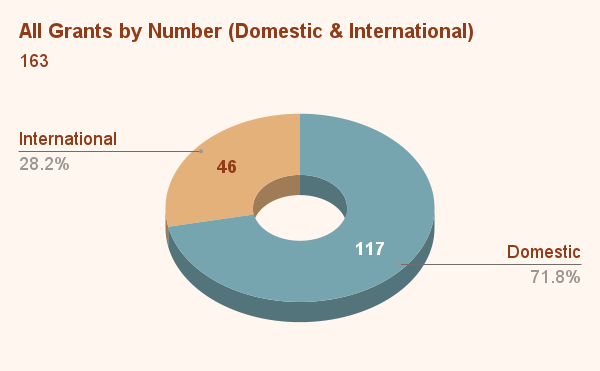
ORANGE/TEAL LIGHT: Domestic (USA) vs International
The teal section represents $1,358,138 in U.S. grants compared to the orange section representing $269,542 international grants through 117 U.S. and 46 International grantees. (These both under-represent international giving since many international programs receive funds through U.S. organizations.)
CIRCLE/DISC: Dollar Total vs Number of Grantees
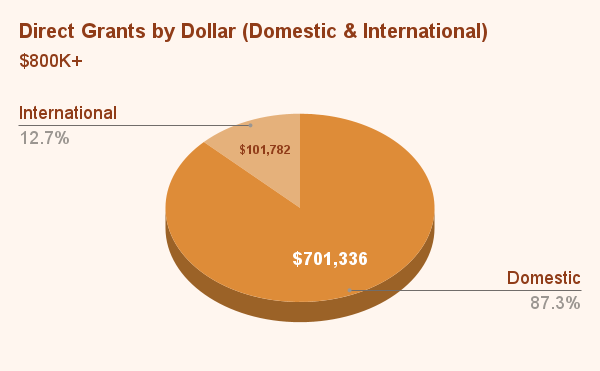
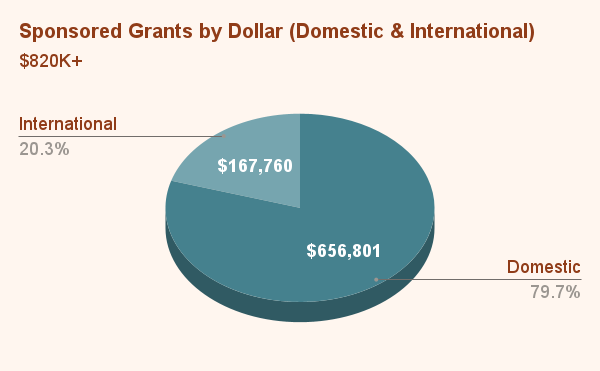
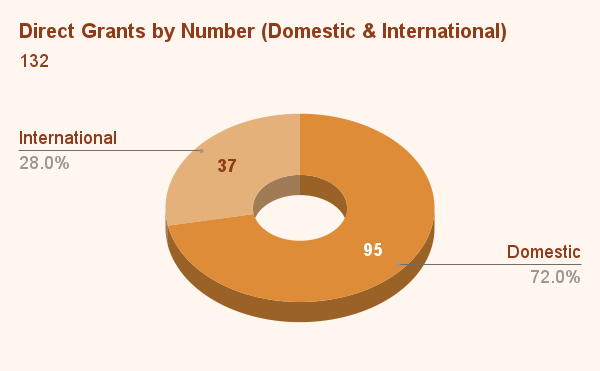
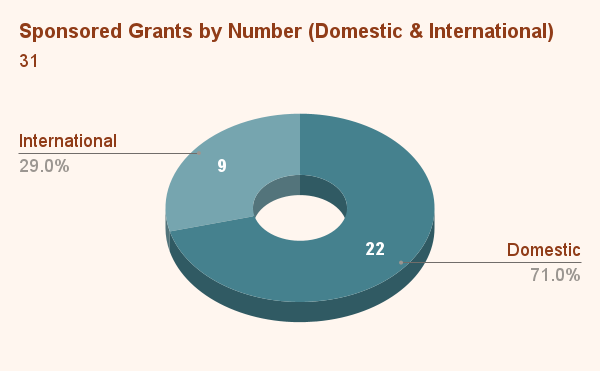
The full circle pie charts (on the left) represent breakdowns by dollar amount. The disc-shaped pie charts (on the right) represent breakdowns by number of grantees (132 direct + 31 fiscally-sponsored = 163 total grantees). Some groups receive multiple grants totalling 260 distributions.
